 NordRif
English translation
Solutions
Data & Analytics — Unlock the value of your data.
Bring together reliable data and make it understandable for your decisions.
Meeting your needs
A dashboard is only useful if its data and definitions are reliable. We start by identifying sources, update frequency and the meaning of metrics, then organise processing and presentation.
Your challenges
Understand metric definitions
Track activity without repeated data entry
What we can build
Database structuring and source integration
Dashboards and visualisations
Reporting and automated reports
Freshness and consistency checks
Our approach and skills
Modelling must specify granularity, identifiers and matching rules. Metrics display their scope and limits; missing data is not treated as zero.
What this approach delivers
Shared definitions make analyses comparable and differences explainable. Data supports decisions without replacing knowledge of real-world operations.
Step-by-step delivery
Understand — Analyse your use cases, users and constraints.
Design — Define scope, journeys and architecture.
Develop — Build in stages and share progress.
Test — Check functionality, security and target environments.
Deploy — Prepare production and onboarding.
Support — Organise follow-up and planned improvements.
Our projects
Discover published products and their documented features.

PassNor
PassNor is a digital loyalty SaaS platform that lets businesses reward their clients through digital loyalty cards, points, stamps and rewards integrated with Google Wallet and Apple Wallet.
Web Application (SaaS)Android (Google Wallet)iOS (Apple Wallet)Flutter mobile application
AngularTypeScriptJavaSpring BootFlutterDartREST APIJWTStripeGoogle Wallet APIApple Wallet (PassKit)QR Code
Ophny
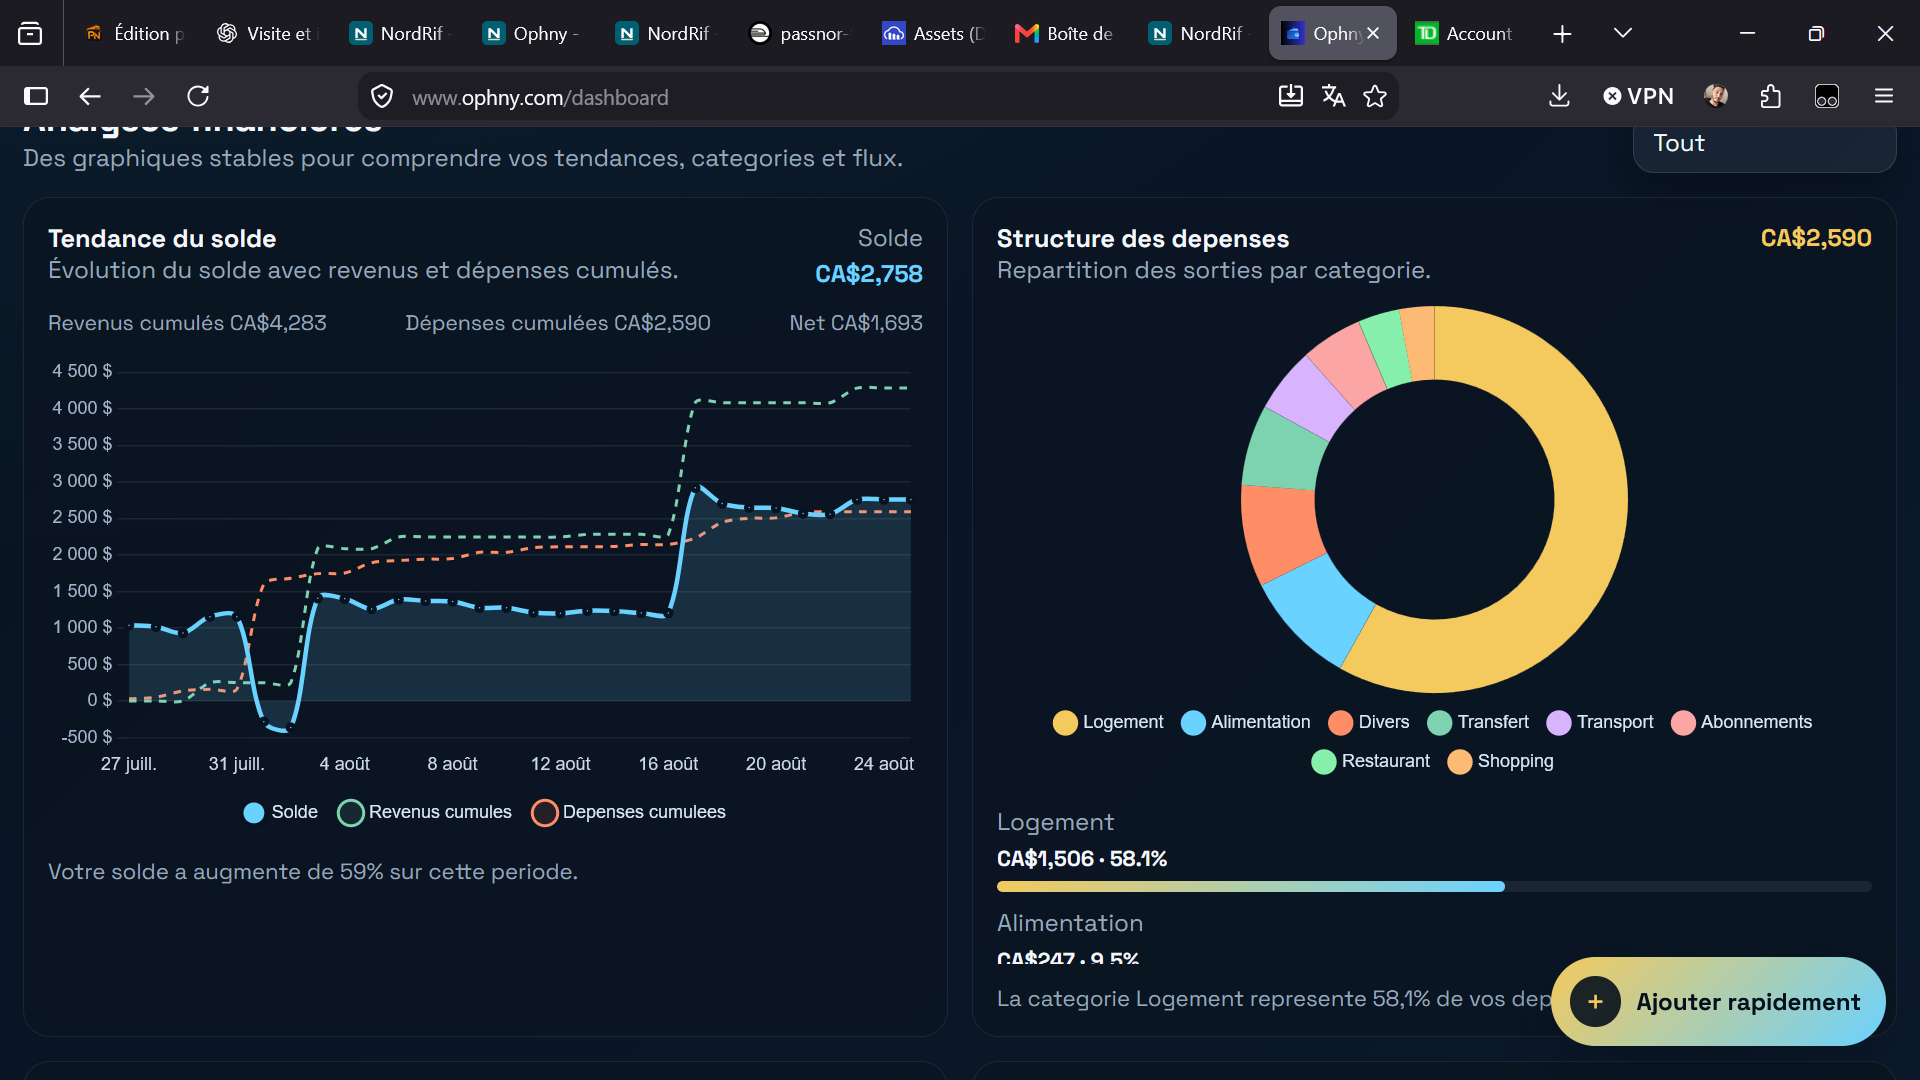
Ophny is an intelligent personal finance management application that helps you track expenses, manage your budget, monitor subscriptions and achieve savings goals using artificial intelligence. Available on web and mobile.
WebAndroidiOS
AngularTypeScriptFlutterDartSpring BootJavaPostgreSQLNode.jsSocket.IOREST APIJWTDockerNginxStripePayPalCloudinaryResendGitHubLinux (Debian)
Let’s discuss your project
Describe your needs, context and priorities. Together, we will examine the options and next steps.